p.24 抽出テキスト
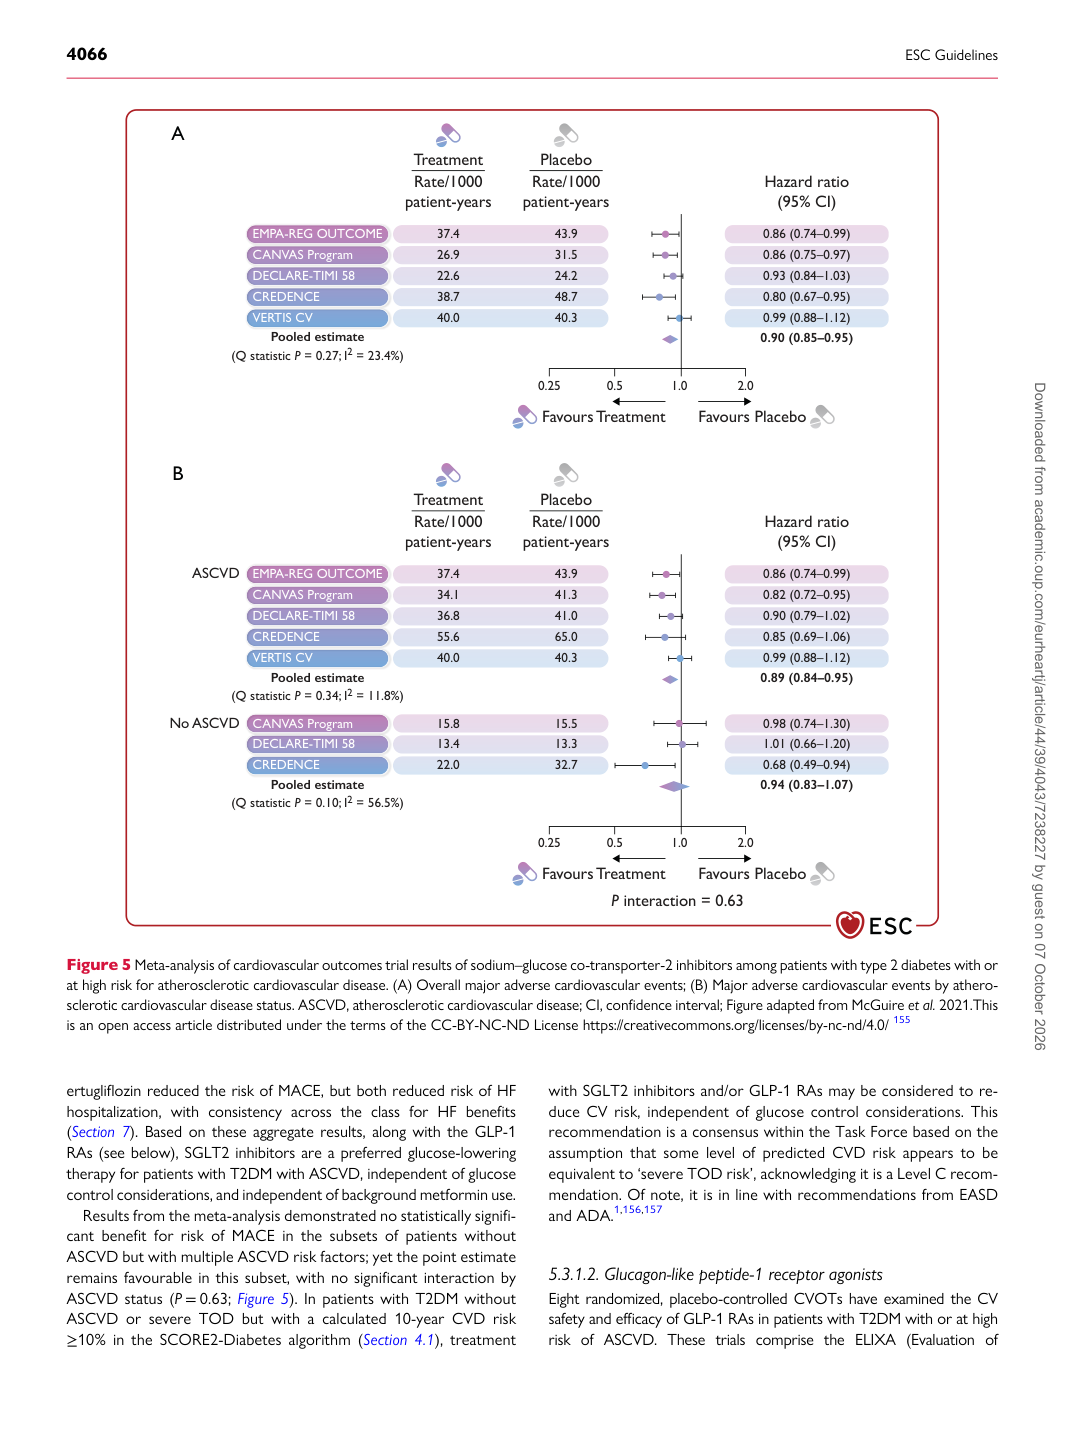
ertugliflozin reduced the risk of MACE, but both reduced risk of HF hospitalization, with consistency across the class for HF benefits (Section 7). Based on these aggregate results, along with the GLP-1 RAs (see below), SGLT2 inhibitors are a preferred glucose-lowering therapy for patients with T2DM with ASCVD, independent of glucose control considerations, and independent of background metformin use. Results from the meta-analysis demonstrated no statistically significant benefit for risk of MACE in the subsets of patients without ASCVD but with multiple ASCVD risk factors; yet the point estimate remains favourable in this subset, with no significant interaction by ASCVD status (P = 0.63; Figure 5). In patients with T2DM without ASCVD or severe TOD but with a calculated 10-year CVD risk ≥10% in the SCORE2-Diabetes algorithm (Section 4.1), treatment with SGLT2 inhibitors and/or GLP-1 RAs may be considered to reduce CV risk, independent of glucose control considerations. This recommendation is a consensus within the Task Force based on the assumption that some level of predicted CVD risk appears to be equivalent to ‘severe TOD risk’, acknowledging it is a Level C recommendation. Of note, it is in line with recommendations from EASD and ADA.1,156,157

5.3.1.2 Glucagon-like peptide-1 receptor agonists

Eight randomized, placebo-controlled CVOTs have examined the CV safety and efficacy of GLP-1 RAs in patients with T2DM with or at high risk of ASCVD. These trials comprise the ELIXA (Evaluation of

0.25 0.5 1.0 2.0

0.25 0.5 1.0 2.0 Favours Treatment Favours Placebo

Favours Treatment Favours Placebo

Treatment Rate/1000 patient-years Placebo

37.4 26.9 22.6 38.7

40.0 43.9

31.5 24.2 48.7 40.3

Rate/1000 patient-years Hazard ratio

(95% CI)

0.86 (0.74–0.99)

0.86 (0.75–0.97)

0.93 (0.84–1.03)

0.80 (0.67–0.95)

0.99 (0.88–1.12) 0.90 (0.85–0.95) Pooled estimate (Q statistic P = 0.27; I2 = 23.4%)

A

Treatment Rate/1000 patient-years Placebo

ASCVD

No ASCVD 37.4 34.1

36.8 55.6

40.0 43.9

41.3 41.0 65.0 40.3

Rate/1000 patient-years Hazard ratio

(95% CI)

0.86 (0.74–0.99)

0.82 (0.72–0.95)

0.90 (0.79–1.02)

0.85 (0.69–1.06)

0.99 (0.88–1.12) 0.89 (0.84–0.95) Pooled estimate (Q statistic P = 0.34; I2 = 11.8%)

EMPA-REG OUTCOME CANVAS Program DECLARE-TIMI 58 CREDENCE VERTIS CV

EMPA-REG OUTCOME CANVAS Program DECLARE-TIMI 58 CREDENCE VERTIS CV

CANVAS Program DECLARE-TIMI 58 CREDENCE 15.8 13.4

22.0 15.5

13.3 32.7 0.98 (0.74–1.30)

1.01 (0.66–1.20)

0.68 (0.49–0.94) 0.94 (0.83–1.07) Pooled estimate (Q statistic P = 0.10; I2 = 56.5%)

P interaction = 0.63

B

Figure 5 Meta-analysis of cardiovascular outcomes trial results of sodium–glucose co-transporter-2 inhibitors among patients with type 2 diabetes with or at high risk for atherosclerotic cardiovascular disease. (A) Overall major adverse cardiovascular events; (B) Major adverse cardiovascular events by atherosclerotic cardiovascular disease status. ASCVD, atherosclerotic cardiovascular disease; CI, confidence interval; Figure adapted from McGuire et al. 2021.This is an open access article distributed under the terms of the CC-BY-NC-ND License https://creativecommons.org/licenses/by-nc-nd/4.0/ 155 Downloaded from academic.oup.com/eurheartj/article/44/39/4043/7238227 by guest on 07 October 2026