p.26 抽出テキスト
Estimates of sPAP are based on the peak tricuspid regurgitation velocity (TRV) and the TRV-derived tricuspid regurgitation pressure gradient (TRPG)—after excluding pulmonary stenosis—taking into account non-invasive estimates of RA pressure (RAP). Considering the inaccuracies in estimating RAP and the amplification of measurement errors by using derived variables,85–87 these guidelines recommend using the peak TRV (and not the estimated sPAP) as the key variable for assigning the echocardiographic probability of PH. A peak TRV .2.8 m/s may suggest PH; however, the presence or absence of PH cannot be reliably determined by TRV alone.88

Lowering the TRV threshold in view of the revised haemodynamic definition of PH is not supported by available data (key narrative question 2, Supplementary Data, Section 5.1).89–92 Tricuspid regurgitation (TR) velocity may underestimate (e.g. in patients with severe TR)28 or overestimate (e.g. in patients with high CO in liver disease or sickle cell disease [SCD],93,94 misinterpretation of tricuspid valve closure artefact for the TR jet, or incorrect assignment of a peak TRV in the case of maximum velocity boundary artefacts) pressure gradients. Hence, additional variables related to RV morphology and function are used to define the echocardiographic probability of PH (Table 10),82–84,95 which may then be determined as low, intermediate, or high. When interpreted in a clinical context, this probability can be used to decide the need for further investigation, including cardiac catheterization in individual patients (Figure 5). Echocardiographic measures of RV function include the tricuspid annular plane systolic excursion (TAPSE), RV fractional area change (RV-FAC), RV free-wall strain, and tricuspid annulus velocity (S′ wave) derived from tissue Doppler imaging, and potentially RV ejection fraction (RVEF) derived from 3D echocardiography. Furthermore, the TAPSE/sPAP ratio—representing a non-invasive measure of RV–PA coupling96—may aid in diagnosing PH.90,97,98 The pattern of RV outflow tract (RVOT) blood flow (mid-systolic ‘notching’) may suggest pre-capillary PH.99,100 To separate between group 2 PH and other forms of PH, and to assess the likelihood of left ventricle (LV) diastolic dysfunction, LA size and signs of LV hypertrophy should always be measured, and Doppler echocardiographic signs (e.g. E/A ratio, E/E′) should be assessed even if the reliability of the latter is considered low.16 To identify CHD, 2D Doppler and contrast examinations are helpful, but transoesophageal contrast echocardiography or other imaging techniques (e.g. computer tomography [CT] angiography, cMRI) are needed in some cases to detect or exclude sinus venosus atrial septal defects, patent ductus arteriosus, and/or anomalous pulmonary venous return.101 The clinical value of exercise Doppler echocardiography in identifying exercise PH remains uncertain because of the lack of validated criteria and prospective confirmatory data. In most cases, increases in sPAP during exercise are caused by diastolic LV dysfunction.16

5.1.6 Ventilation/perfusion lung scan

A ventilation/perfusion (V/Q) lung scan (planar or single-photon emission computed tomography [SPECT]) is recommended in the diagnostic work-up of patients with suspected or newly diagnosed PH, to rule out or detect signs of CTEPH.102,103 The V/Q SPECT is superior to planar imaging and is the methodology of choice; however, SPECT has been widely evaluated in assessing PE, but not to the same degree in CTEPH.68 In the absence of parenchymal lung disease, a normal perfusion scan excludes CTEPH with a negative predicted value of 98%.104,105 In most patients with PAH, V/Q scintigraphy is normal or shows a speckled pattern but no typical perfusion defects characteristic of PE or CTEPH, whereas matched V/Q defects may be found in patients with lung disease (i.e. group 3 PH). Non-matched perfusion defects similar to those seen in

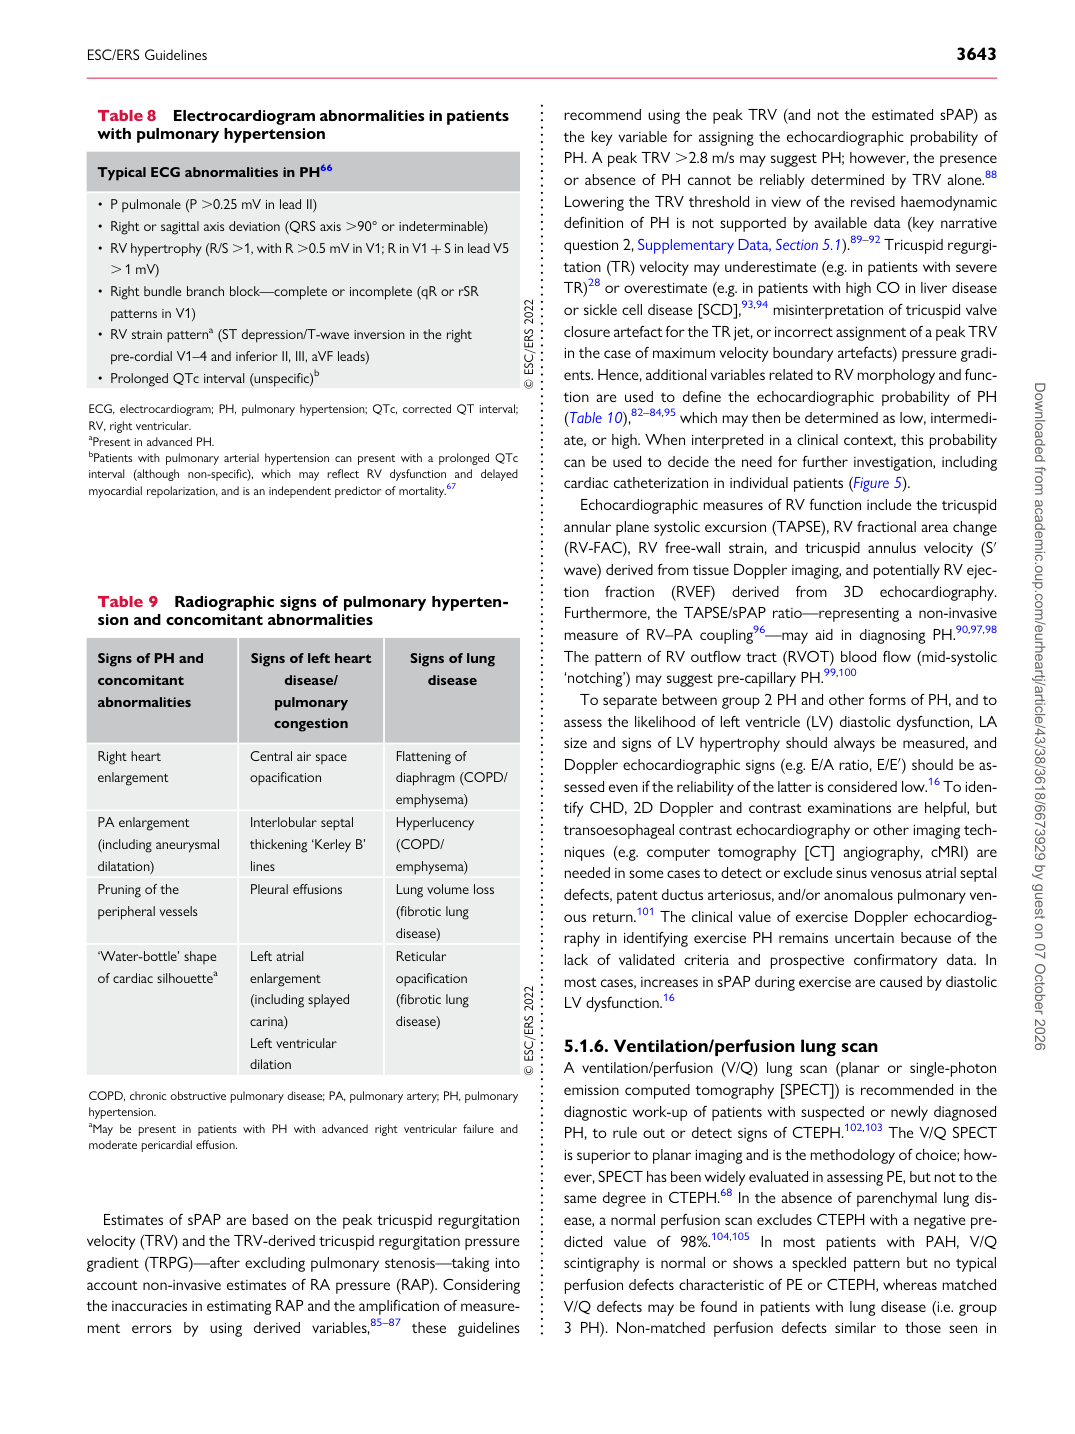
Table 9 Radiographic signs of pulmonary hypertension and concomitant abnormalities

Signs of PH and concomitant abnormalities Signs of left heart

disease/ pulmonary congestion Signs of lung

disease

Right heart enlargement Central air space opacification Flattening of diaphragm (COPD/

emphysema)

PA enlargement (including aneurysmal dilatation) Interlobular septal

thickening ‘Kerley B’ lines Hyperlucency

(COPD/ emphysema)

Pruning of the peripheral vessels Pleural effusions Lung volume loss

(fibrotic lung disease)

‘Water-bottle’ shape of cardiac silhouettea Left atrial enlargement

(including splayed carina) Left ventricular dilation Reticular opacification

(fibrotic lung disease) © ESC/ERS 2022

COPD, chronic obstructive pulmonary disease; PA, pulmonary artery; PH, pulmonary hypertension. aMay be present in patients with PH with advanced right ventricular failure and moderate pericardial effusion.

Table 8 Electrocardiogram abnormalities in patients with pulmonary hypertension

Typical ECG abnormalities in PH66

• P pulmonale (P .0.25 mV in lead II) • Right or sagittal axis deviation (QRS axis .90° or indeterminable) • RV hypertrophy (R/S .1, with R .0.5 mV in V1; R in V1 + S in lead V5

. 1 mV) • Right bundle branch block—complete or incomplete (qR or rSR patterns in V1) • RV strain patterna (ST depression/T-wave inversion in the right pre-cordial V1–4 and inferior II, III, aVF leads) • Prolonged QTc interval (unspecific)b © ESC/ERS 2022 ECG, electrocardiogram; PH, pulmonary hypertension; QTc, corrected QT interval; RV, right ventricular. aPresent in advanced PH. bPatients with pulmonary arterial hypertension can present with a prolonged QTc interval (although non-specific), which may reflect RV dysfunction and delayed myocardial repolarization, and is an independent predictor of mortality.67 Downloaded from academic.oup.com/eurheartj/article/43/38/3618/6673929 by guest on 07 October 2026