p.24 抽出テキスト
.................................................................. models that do not take into account the competing risk of non- CVD mortality, tend to overestimate the actual 10-year risk of CVD, and hence overestimate the potential benefit of treatment.71 The SCORE2-OP algorithm estimates 5-year and 10-year fatal and nonfatal CVD events (myocardial infarction, stroke) adjusted for competing risks in apparently healthy people aged >_70 years.72

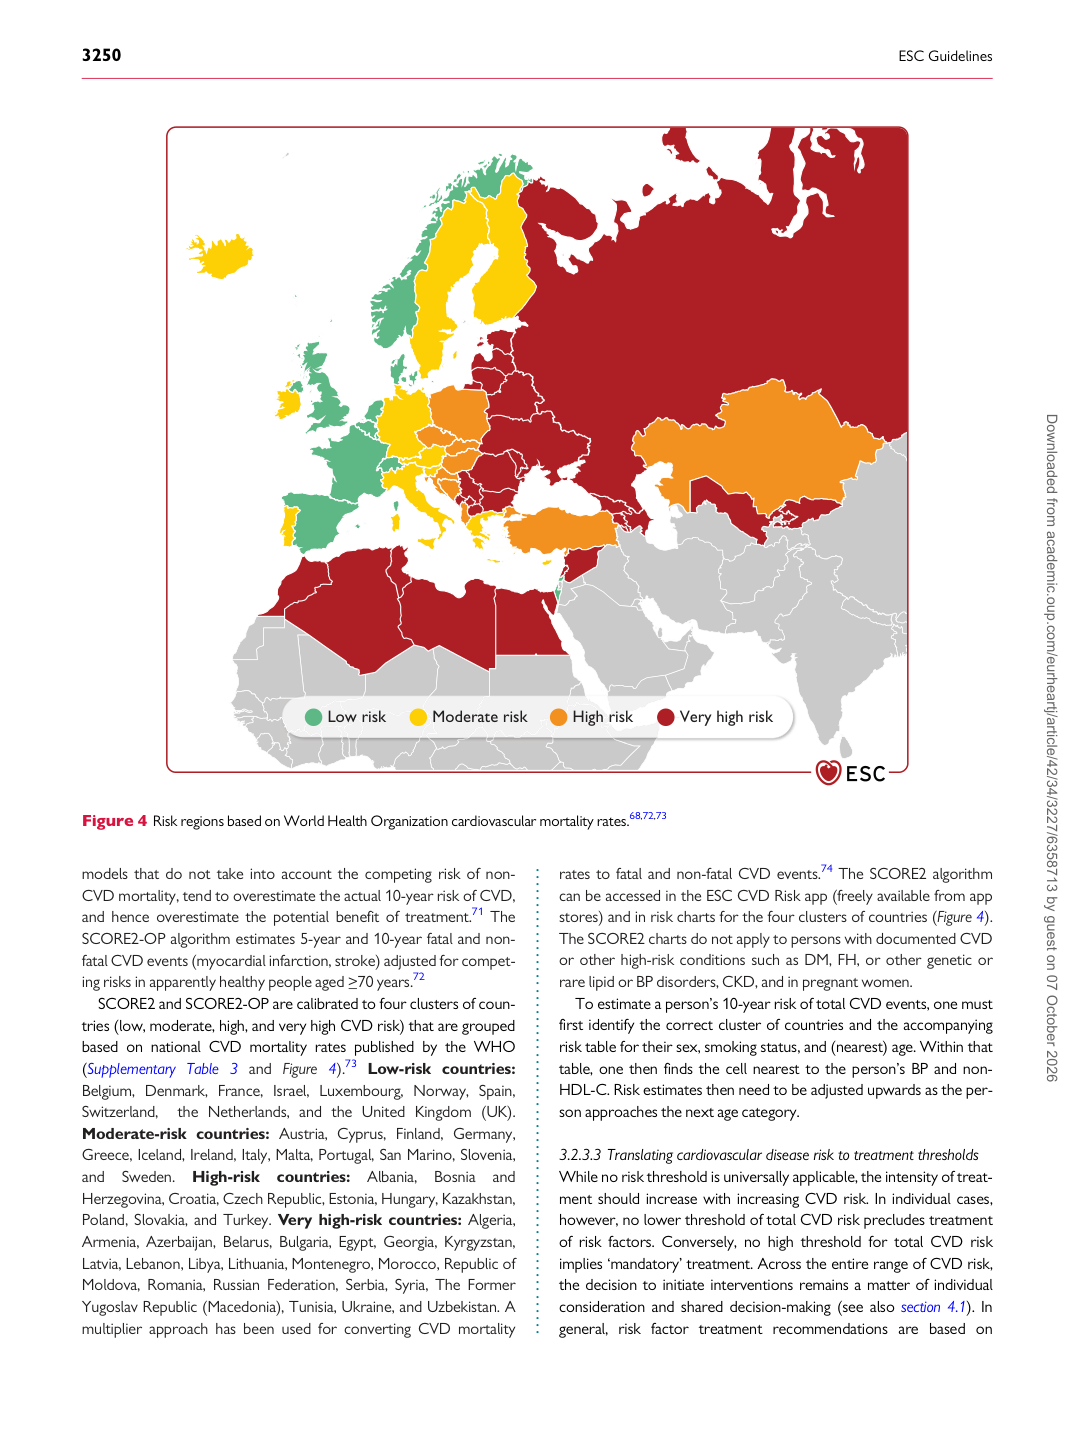
SCORE2 and SCORE2-OP are calibrated to four clusters of countries (low, moderate, high, and very high CVD risk) that are grouped based on national CVD mortality rates published by the WHO (Supplementary Table 3 and Figure 4).73 Low-risk countries: Belgium, Denmark, France, Israel, Luxembourg, Norway, Spain, Switzerland, the Netherlands, and the United Kingdom (UK). Moderate-risk countries: Austria, Cyprus, Finland, Germany, Greece, Iceland, Ireland, Italy, Malta, Portugal, San Marino, Slovenia, and Sweden. High-risk countries: Albania, Bosnia and Herzegovina, Croatia, Czech Republic, Estonia, Hungary, Kazakhstan, Poland, Slovakia, and Turkey. Very high-risk countries: Algeria, Armenia, Azerbaijan, Belarus, Bulgaria, Egypt, Georgia, Kyrgyzstan, Latvia, Lebanon, Libya, Lithuania, Montenegro, Morocco, Republic of Moldova, Romania, Russian Federation, Serbia, Syria, The Former Yugoslav Republic (Macedonia), Tunisia, Ukraine, and Uzbekistan. A multiplier approach has been used for converting CVD mortality rates to fatal and non-fatal CVD events.74 The SCORE2 algorithm can be accessed in the ESC CVD Risk app (freely available from app stores) and in risk charts for the four clusters of countries (Figure 4). The SCORE2 charts do not apply to persons with documented CVD or other high-risk conditions such as DM, FH, or other genetic or rare lipid or BP disorders, CKD, and in pregnant women.

To estimate a person’s 10-year risk of total CVD events, one must first identify the correct cluster of countries and the accompanying risk table for their sex, smoking status, and (nearest) age. Within that table, one then finds the cell nearest to the person’s BP and non- HDL-C. Risk estimates then need to be adjusted upwards as the person approaches the next age category.

3.2.3.3 Translating cardiovascular disease risk to treatment thresholds While no risk threshold is universally applicable, the intensity of treatment should increase with increasing CVD risk. In individual cases, however, no lower threshold of total CVD risk precludes treatment of risk factors. Conversely, no high threshold for total CVD risk implies ‘mandatory’ treatment. Across the entire range of CVD risk, the decision to initiate interventions remains a matter of individual consideration and shared decision-making (see also section 4.1). In general, risk factor treatment recommendations are based on

High risk Moderate risk

Very high risk Low risk

Figure 4 Risk regions based on World Health Organization cardiovascular mortality rates.68,72,73 Downloaded from academic.oup.com/eurheartj/article/42/34/3227/6358713 by guest on 07 October 2026